On this page you will see the following content:
Introduction
There’s no doubt that a big part of the population loves to travel, know new cultures, and new places, or admire the natural beauty of our planet. According to the UNWTO (United Nations World Tourism Organization), in 2019, there were 1.462 million tourist landings around the world, almost 4% higher than the year before, accumulating $1.480 billion.
According to the 2019 International Travel Survey that interviewed more than one thousand Brazilian travelers, 37% said that travels are their principal investment. However, it doesn’t mean that they like to spend too much while traveling, that’s why everyone it’s used to searching for offers and researching a lot about the place they are going to.
Thinking about reducing expenses, companies created search mechanisms that assist travelers in finding the best offers. Among these exist travel agencies, traveling blogs, traveling social networks, etc. One of the most popular resources is Airbnb.

Airbnb it’s known as one of the biggest companies of the moment and gained good recognition in 11 years of history. Briefly, it is a service that allows people to rent their houses or part of them for travelers around the world for a determined period.
At the beginning of 2020, Airbnb counted more than 7 million authentic and unique lofts.
—————————————————————————————————————
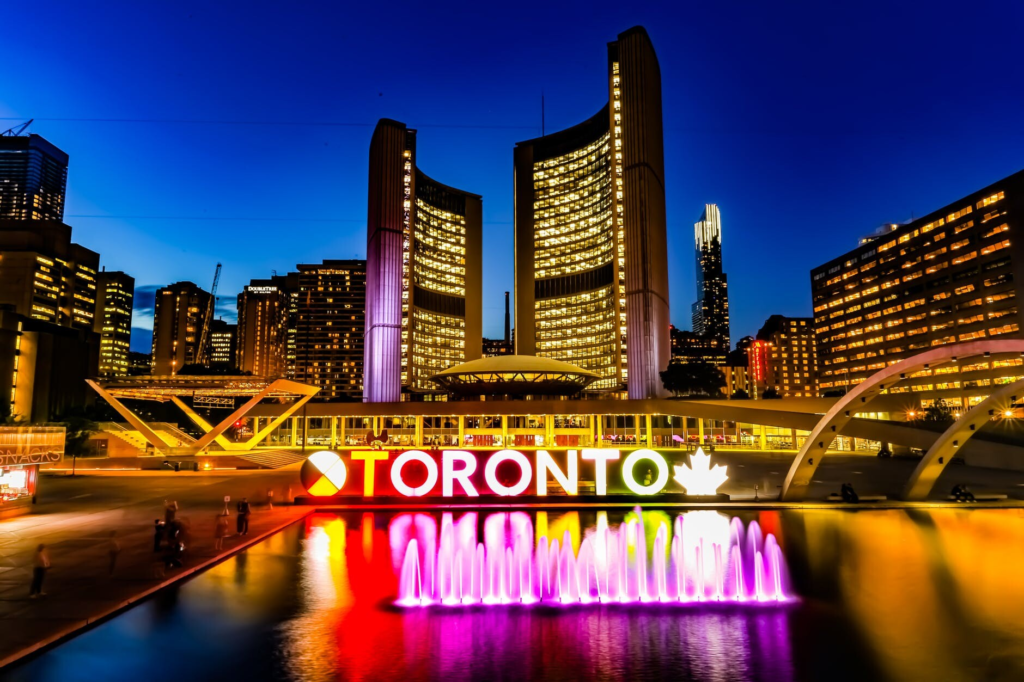
Toronto
Founded in 1824, Toronto is considered one of the more multicultural cities on the planet. It is the biggest city in Canada and the fourth biggest north-American county.
While walking by the city streets is easy to notice a strong influence coming from numerous cultures around the world. As an example, we have Little Italy and Chinatown, which both strongly represents the traditional culture of your ancestors.
The Canadian city is one the most popular travel destinations in the country because it offers a world of attractions, and let’s not forget that it stays between Montreal, Chicago, and New York facilitating the permutation for tourists.
Project
The idea of this study is to analyze data from Airbnb and obtain information about prices, places, and quality in general of listings in the city.
We are going to establish some basic questions and develop python codes to answer it, however, in this article, we have only the insights and results of the analysis. If you want the complete project and the step-by-step code, go to the project page on my GitHub repository.
Obtaining Data
I obtained the data used in this project from the Inside Airbnb website. They are an organization that uses tools and information to allow everyone to explore the cultural changes in the neighborhood that offers Airbnb accommodations.
For this analysis, we are going to use the following file:
- listings.csv = Summary information and metrics for listings in Toronto (good for visualizations).
Analysis
Let’s start our analysis by asking and answering some questions and see what we have to learn from it.
1 – What kind of listing is more popular?
Airbnb’s mission is to make everyone feels comfortable and safe on your trip. To do so, they offer a list of different accommodations to make sure that’s a special place for each person. As we can see from the graphic below, in Toronto 64% of the accommodations are Entire home/apt.

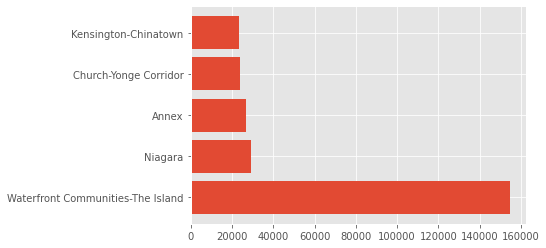
2 – Which are the five neighborhoods with more available places?
Among the numerous neighborhoods in the city, below we have the five with more listings registered.

3 – Which neighborhoods have more reviews?
By simple logic, it would make sense to say that the neighborhoods with more listing options would have more reviews, correct? According to the data, NO!
From the graphic below we see that Bay Street Corridor loses its place on the list to Kinsington-Chinatown.
OK, so it means that the neighborhood is worse? Not exactly, there are a lot of factors that may have changed these results, as example, sometimes people don’t like leaving a review, lowering the chances to be classified as a better place.
4 – Where are the most expensive locations?
In the table below we have the renting mean values for every five neighborhoods ranked from higher to lowest. With the information below, we see that a good part of the neighborhoods mentioned above is not classified as more expensive. That’s a super important point to analyze while planning a trip.

5 – Which listing has the best cost x benefit relation?
After analyzing the past questions, you might believe that the best place to stay would be at Waterfront Comunities. However, while traveling, it’s crucial to control your finances, so we can’t determine the best place by only looking at the reviews.
As everyone knows, all products have a cost-benefit, and it determines which is best for each client, depending on its budget. When talking about renting, the same thing happens.
Here, we are going to calculate the neighborhoods with more reviews’ cost-benefit.

After evaluating this new variable, we see that the neighborhood which offers the best stay is the Dovercourt-Wallace Emerson-Junction, which is different from the expected result.
—————————————————————————————————————
Based on the data we got the number of 21,017 listings registered on Airbnb and looking at the map below it’s possible to notice that there are really scattered, embracing a big part of the city territory.
We used the Latitude and Longitude variables to build the map/graph below.

—————————————————————————————————————
Conclusion
From the data available, it was possible to do an exploratory analysis where we identified and dealt with outliers and missing values. Even if we used the simple version of the Dataset, it was possible to find interesting insights from the data, and anyone interested in visiting Toronto can use it easily.
That being said, let’s remember some of these insights.
Toronto city has more than 20 thousand listings registered on Airbnb, divided into 64% of entire apt/houses, 34% of private rooms, 2% of shared rooms, and less than 0,5% of hotel rooms.
The neighborhood with more listings available and more reviews is the Waterfront Communities-The Island, in downtown. It is known as the house of the Distillery District, the Fashion District, St. Lawrence Market, the West Don Lands, and Billy Bishop Airport, popular tourist places.
This study was a simple analysis based on the summarized data from Airbnb. To a complete project, you can use the files available on Inside Airbnb.